|
|
|
VERTEBROLOGY Vertebrograms analysis in the 'ROFES-diagnostics'
Note: for a backbone in functional state, the typical norm or compensated state is:
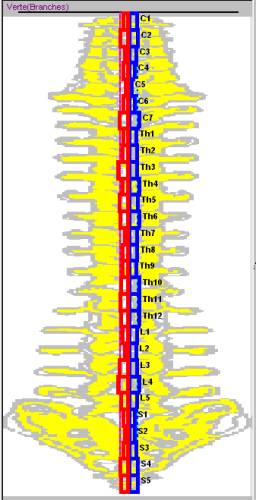
Amplitudes analysis for the blue and red diagrams:
Examples of vertebrograms analysis
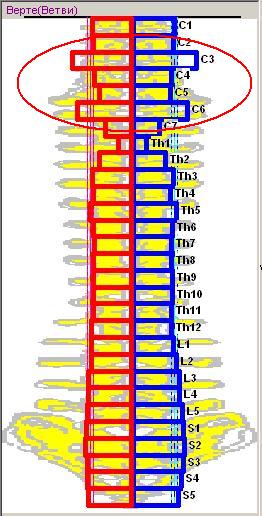
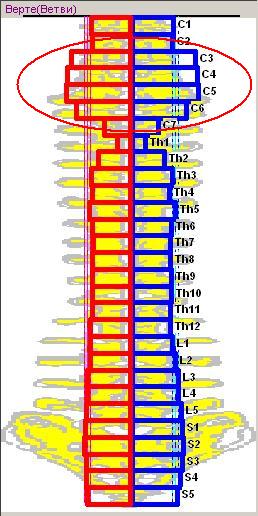
4. Hypermobility (instability) - the amplitude for both red and blue is markedly directed to the diagram's edge in comparison with the other vertebrae (equally strong towards the edge - to Yin А1 = А2) (usually after fixation). Hypermobility at vertebrae level C3 and C6
5.
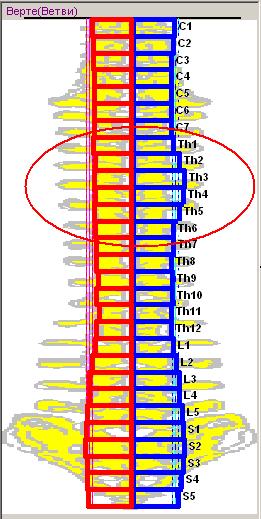
Area of hypermobility - amplitudes of 3 and more vetebrae for both
red and blue are markedly directed to the diagram's edge in comparison
with the other vertebrae (3 and more vertebrae equally strong towards
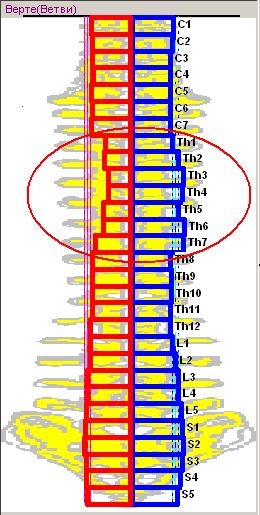
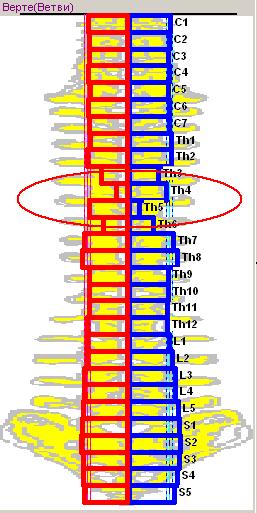
the edge - to Yin А1 = А2) 6. Ligaments block - the amplitude for red and blue diagrams is directed towards the centre in comparison with other vertebrae. The amplitude of the opposite diagram is at the norm level (А1 - markedly to the centre, to Yang, А2 is within the norm, but not too distinct, or vice versa). Ligament block at Th4 - Th5 level
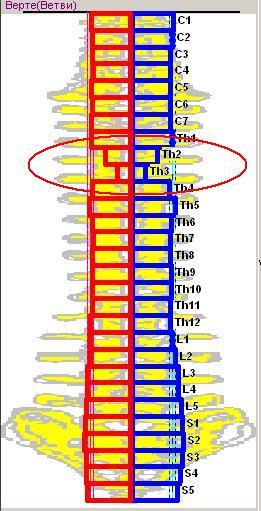
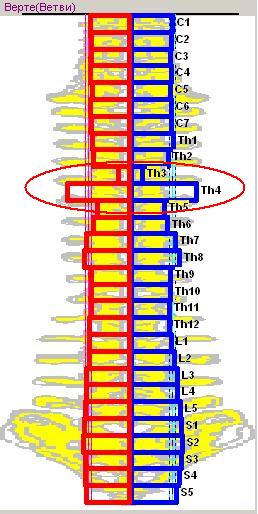
7. Subluxation
- the amplitudes of the higher vertebra are markedly directed towards
the centre - to Yang, and the amplitudes of the lower one - to the
edge - to Yin).
8.
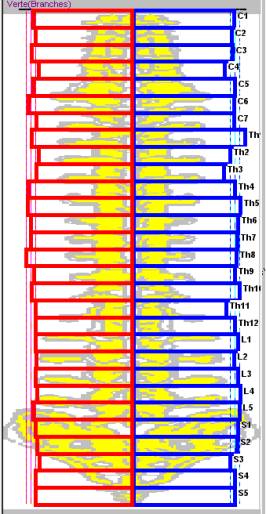
Total osteochondrosis
9.
Osteoporosis For patients measured in the Su Jok microsystem, this reading most often indicates a stress state, rather than osteoporosis. The amplitudes for red and blue diagrams are as close as possible to the centre.
|
|||||||||||||||||||||||||||
| Copyright © 2001-2075 Altaim |
Все права на использование аббревиатуры «РОФЭС®» защищены Федеральным законом РФ «О товарных знаках, знаках обслуживания и наименованиях мест происхождения товара» ст. 46. Использование товарного знака «РОФЭС®» на сайтах в сети интернет может быть только с ссылкой и обязательным переходом на сайт https://rofes.pro. | |||||||||||||||||||||||||||